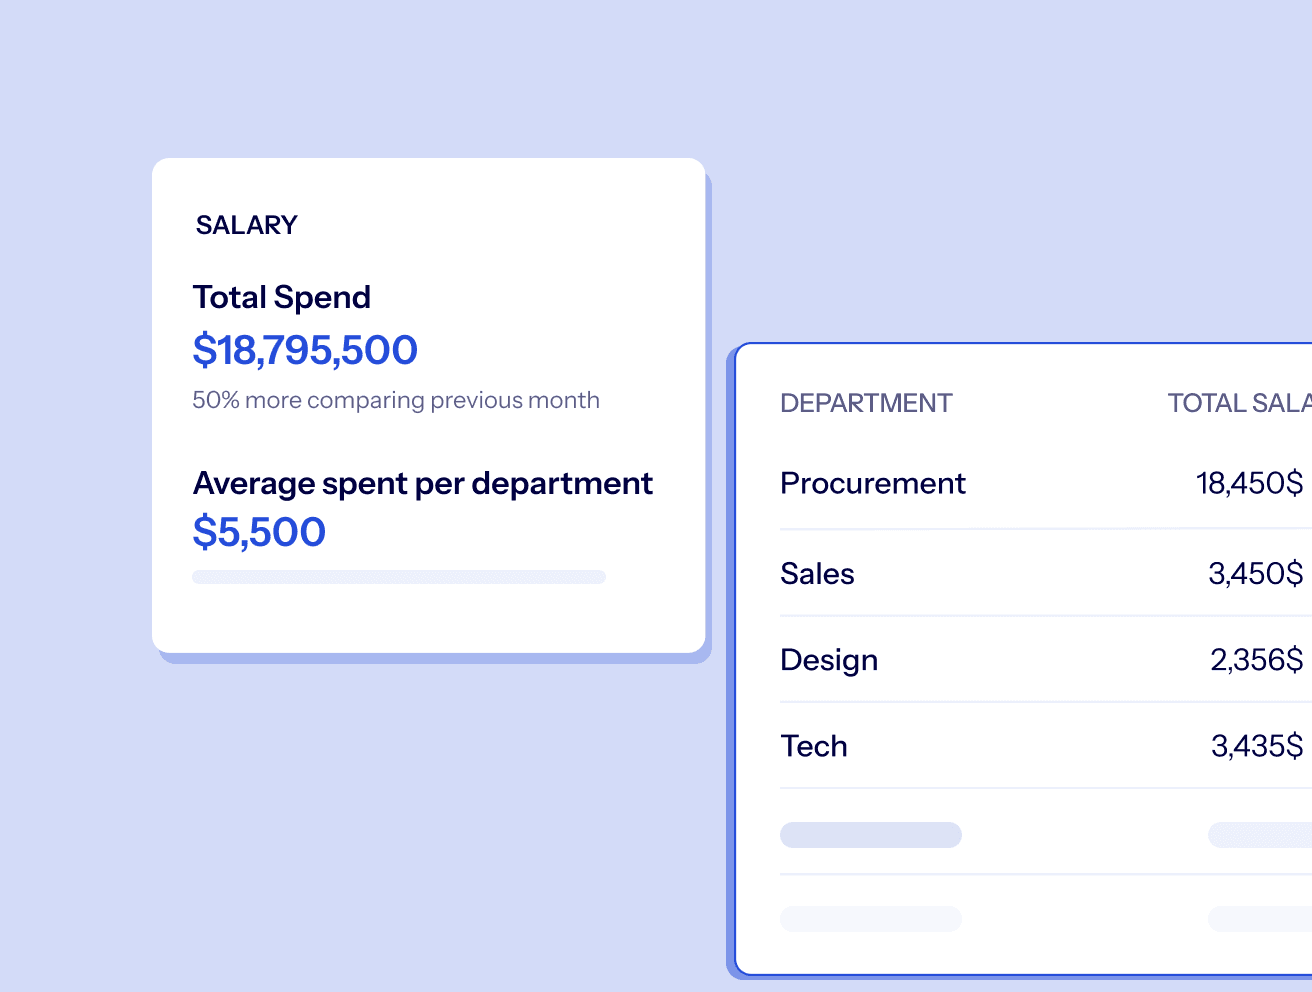
Empowering your business with the power of data

Transform Data into Actionable Insights

Simplify workforce data management and empower smarter, data-driven decisions with ease
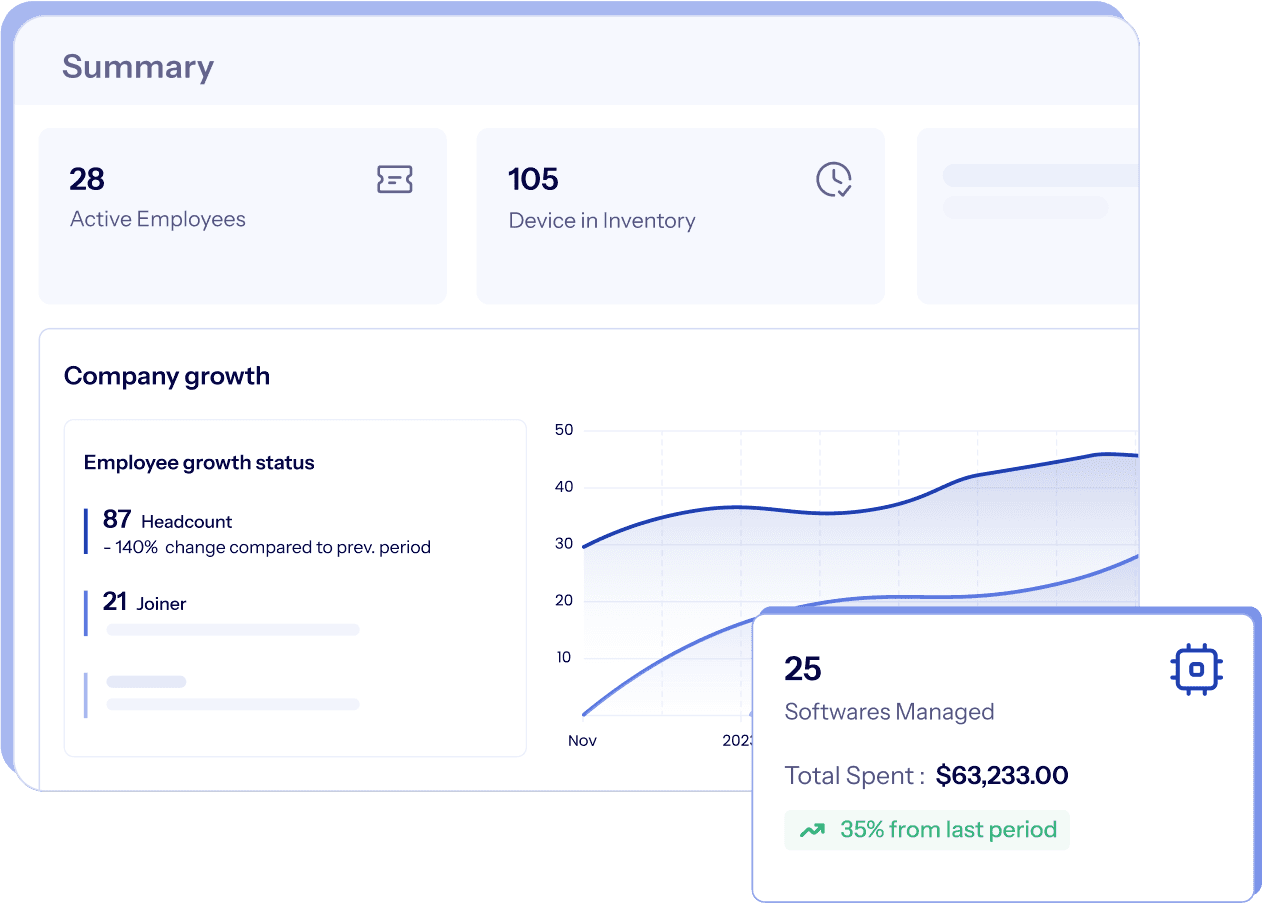
hero-image
[object Object]-icon
[object Object]-icon
[object Object]-icon
[object Object]-icon
[object Object]-icon
[object Object]-icon
[object Object]-icon
[object Object]-icon
[object Object]-icon
[object Object]-icon
[object Object]-icon
[object Object]-icon
[object Object]-icon
[object Object]-icon
[object Object]-icon
[object Object]-icon
[object Object]-icon
[object Object]-icon
[object Object]-icon
[object Object]-icon
[object Object]-icon
[object Object]-icon
image
Unified Analytics

Get the Complete Picture with Unified Analytics

Integrate all your data sources into one platform for a comprehensive view of your business, enabling smarter, data-based decisions.
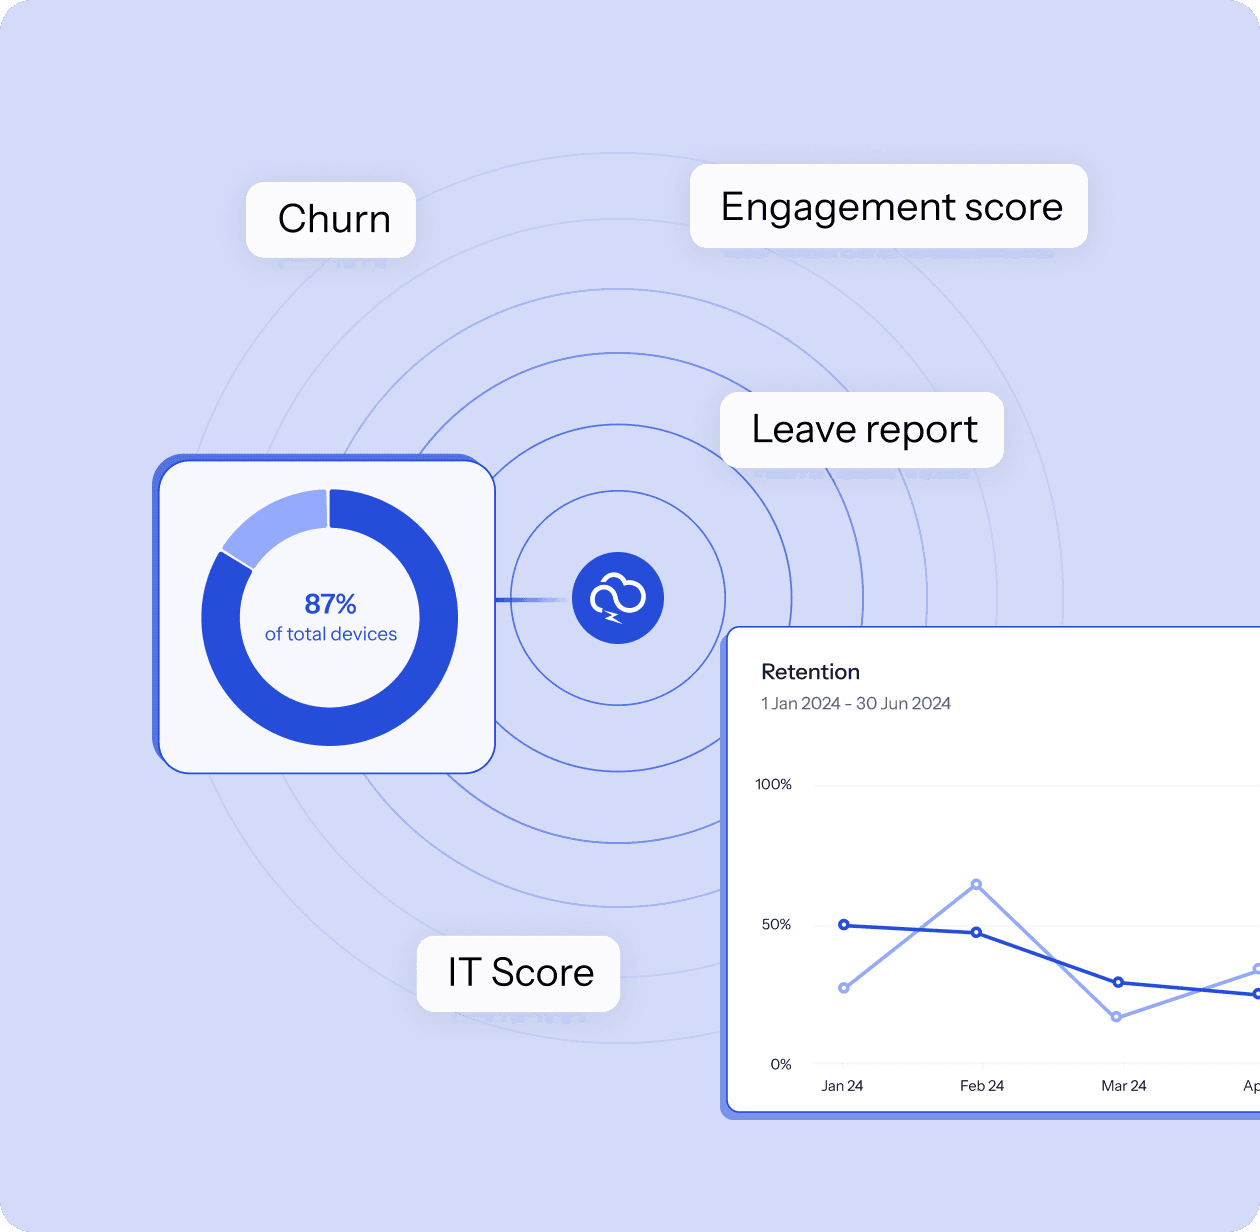
  • check-iconAccess over 30+ data points from HR, IT, and Finance teams
  • check-iconImprove decision-making efficiency by up to 60%
image
No-Code Report Building

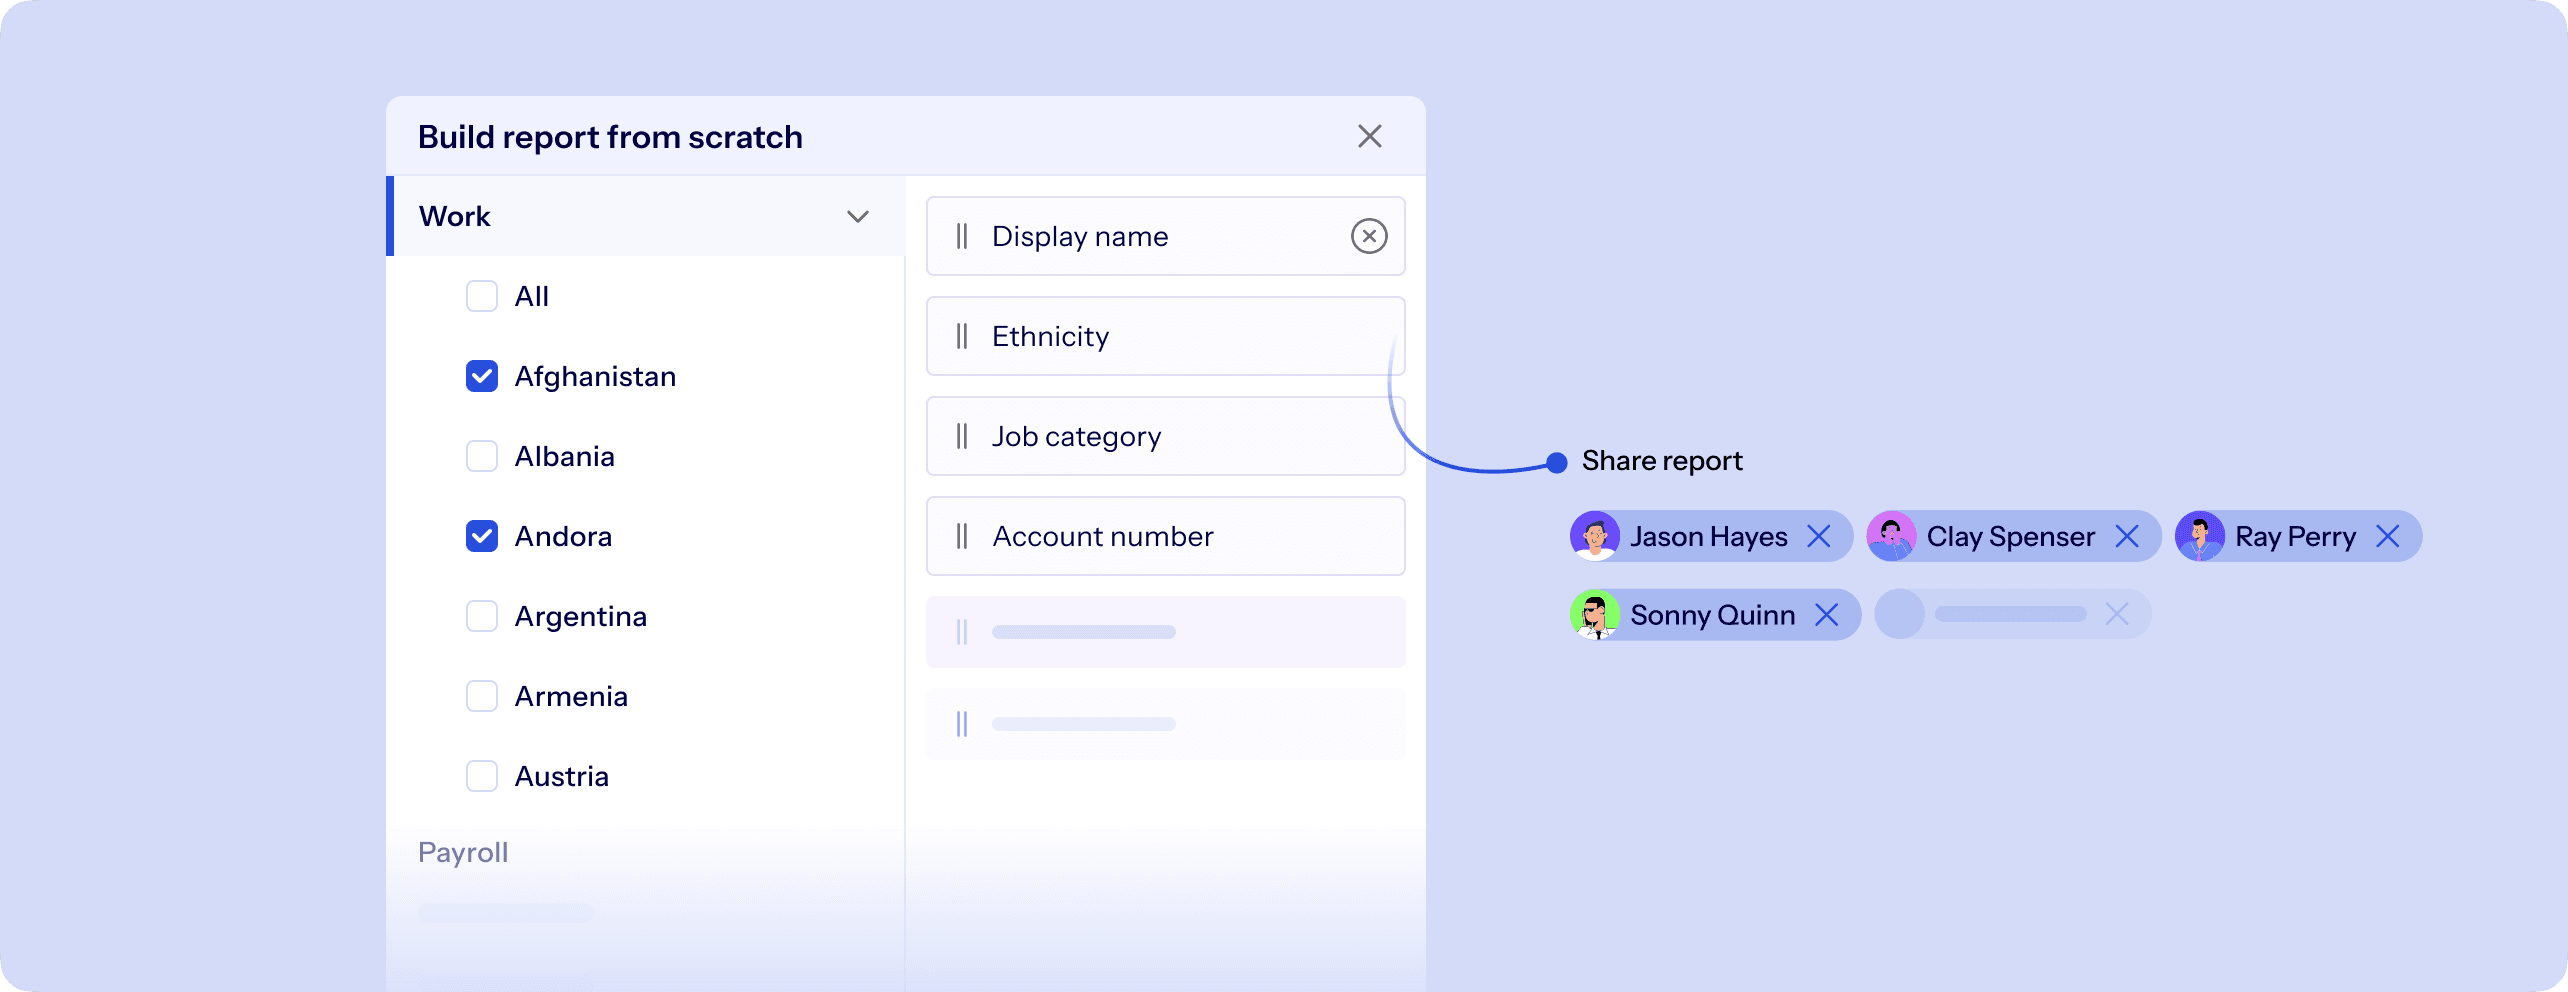
Empower Your Team with No-Code Reports

Create detailed, accurate reports in seconds to inform strategic decisions and keep your stakeholders in the loop. Enable your team to build complex reports effortlessly without needing any technical skills, making data insights accessible to everyone.

  • check-iconReduce reporting time by 50%
  • check-iconBuild reports up to 4x faster than with traditional methods
icon
DEI

Analytics

icon
Headcount trend and attrition rate
icon
Compensation

Report

icon
App Activity

Report

  • check-iconReduce reporting time by 50%
  • check-iconBuild reports up to 4x faster than with traditional methods
section-image

Promote a Fair and Inclusive Workplace

Measure and analyze diversity, equity, and inclusion metrics to foster a more equitable environment and ensure every employee feels valued.
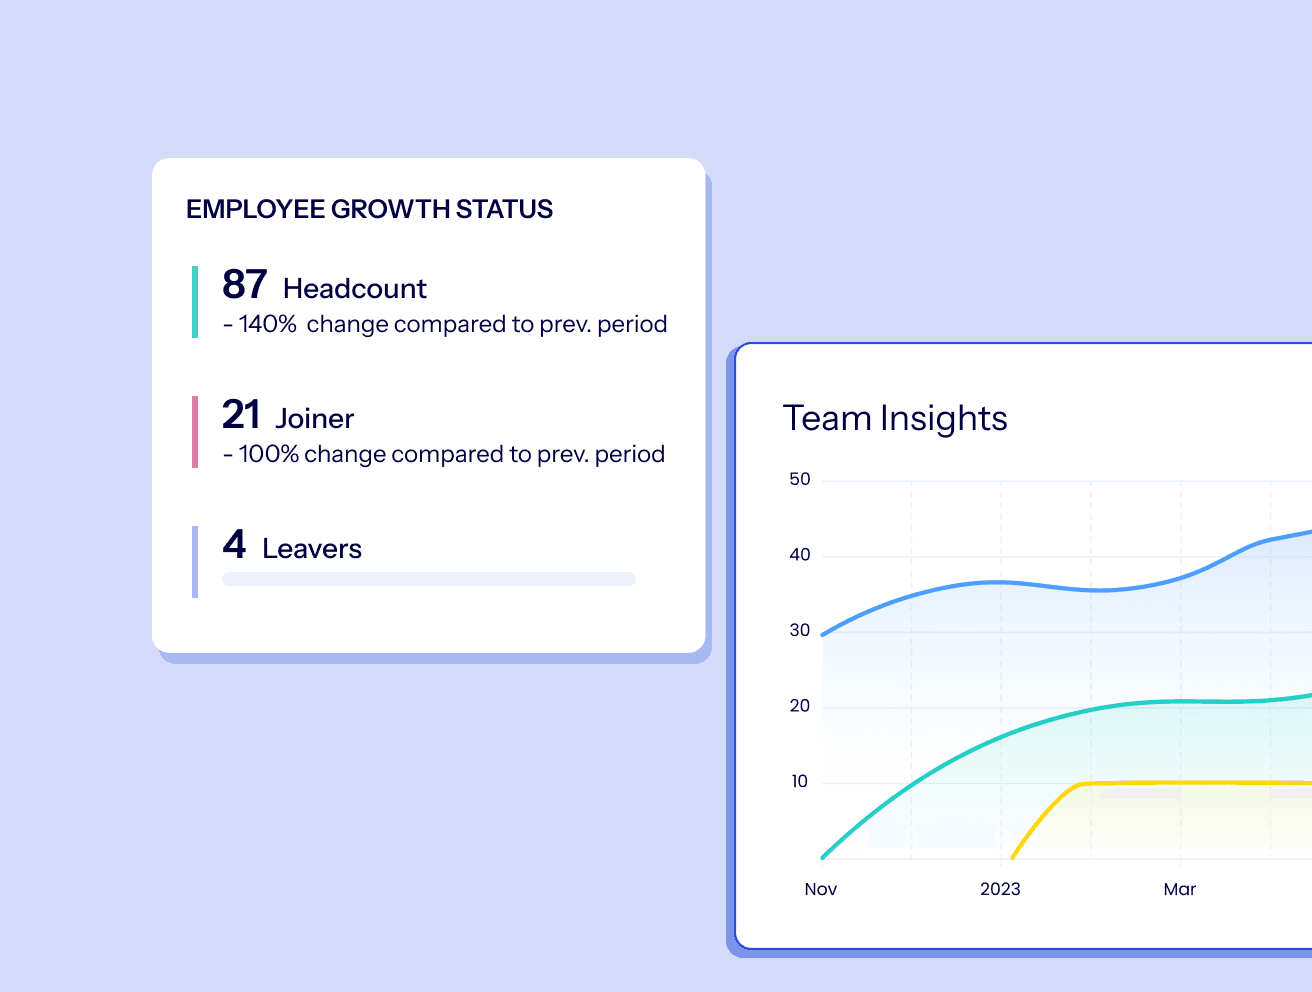
  • check-iconTrack diversity statistics across 10+ DEI categories
  • check-iconAccess headcount trends and attrition rate insights
section-image

Predict and Prevent Attrition

Monitor hiring and turnover trends to anticipate staffing needs, develop retention strategies, and keep your best talent onboard.
  • check-iconImprove retention efforts through actionable insights

Generate customized, accurate reports in a blink and share them with your team

image
icon
Role based permissions (RBAC)

Secure Data with Role-Based Access

Ensure data security by controlling access with role-based permissions, so employees only see information relevant to their role.
image

Empower Decision-Makers with Self-Service Reports

icon
Every employee can access a report builder, enabling them to generate reports on any data within their scope. For example, department heads can track project progress and performance metrics independently, without waiting for updates from the Analytics team.
icon
When sharing reports, only authorized data is visible to the recipient. If their permissions change, the report data updates automatically to maintain security.
icon
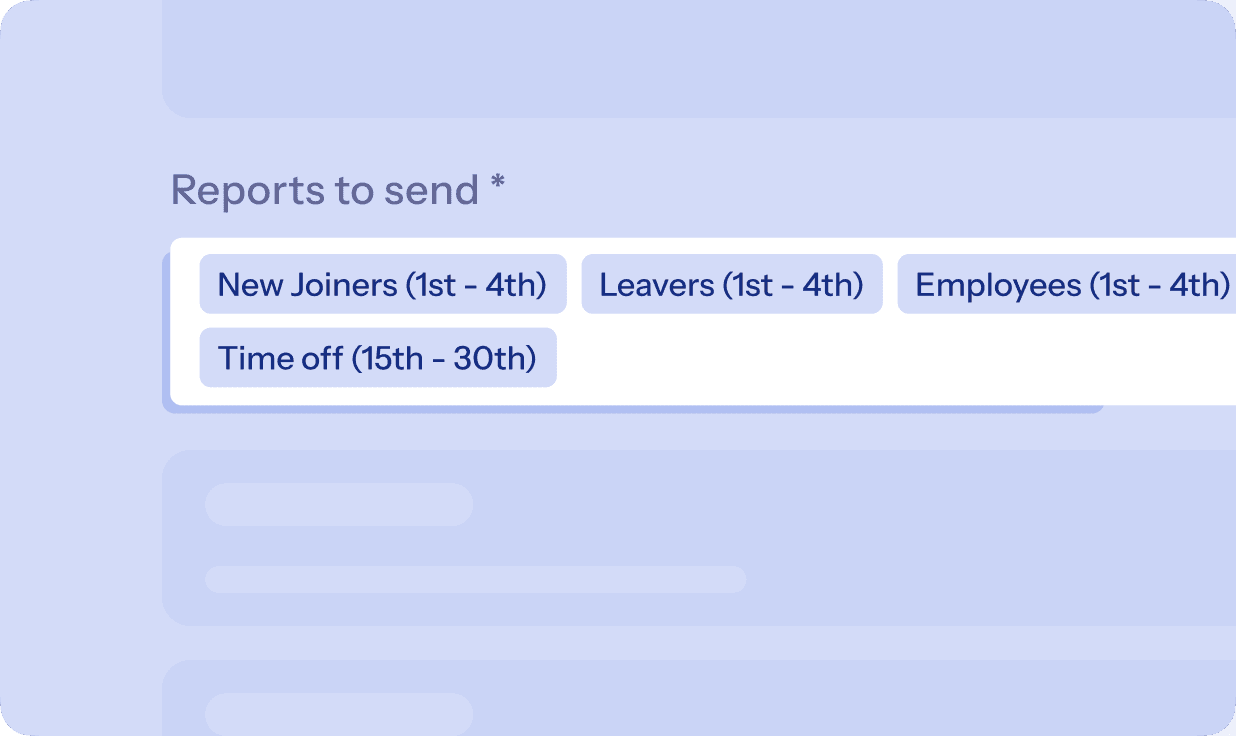
Schedule report distribution by setting up workflows. Choose "Send a report" as the action, ensuring timely delivery to the right stakeholders.
section-image

Accelerate Insights with Ready-Made Templates

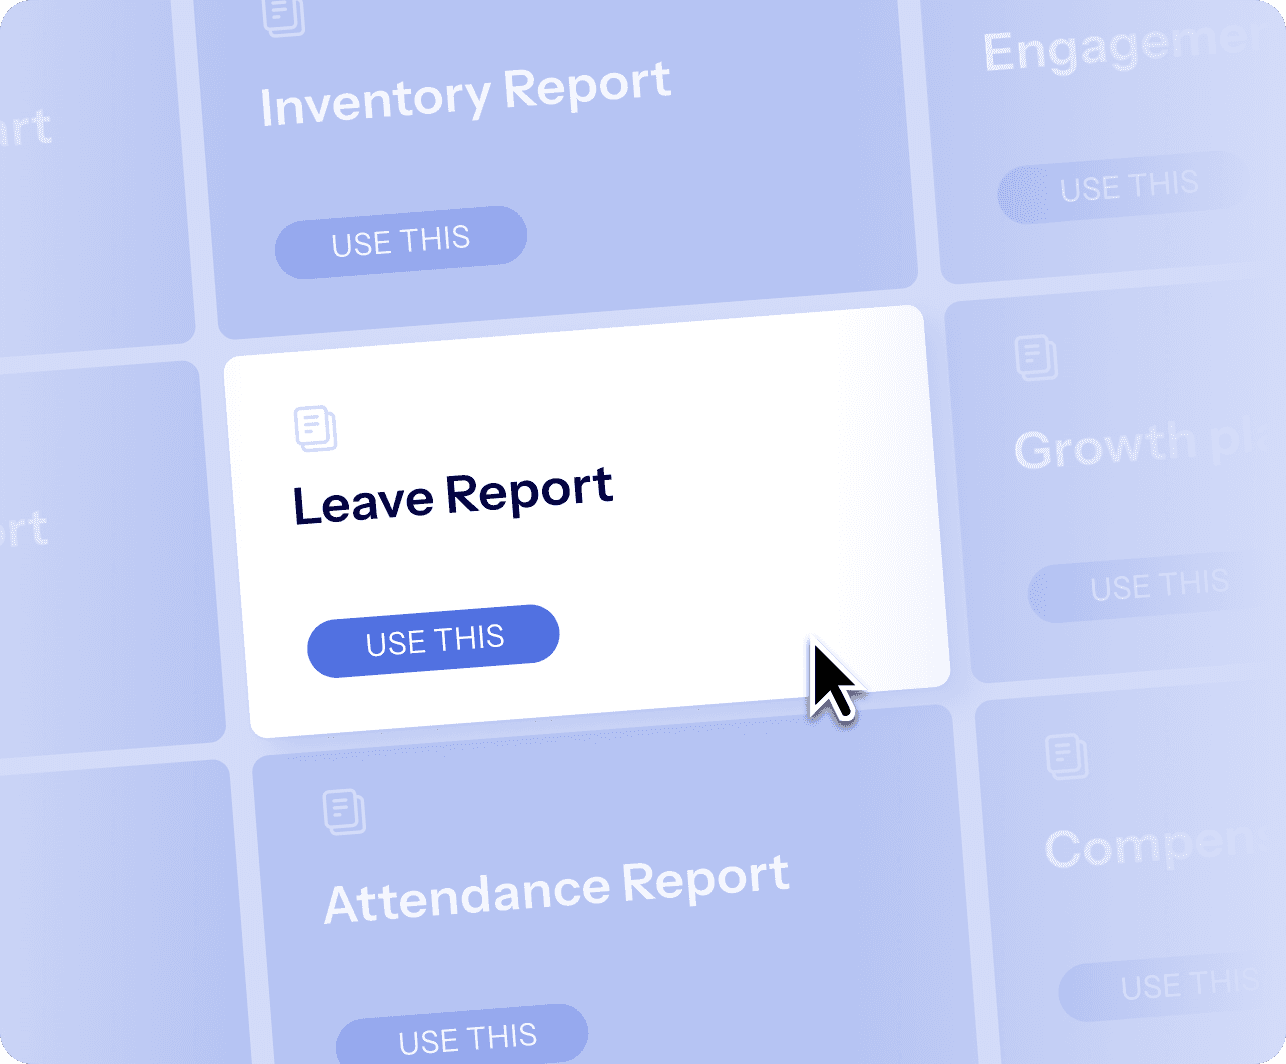
Leverage a wide range of pre-built templates to quickly generate reports and analytics, customized to your specific needs.

  • check-icon20+ pre-built templates available for immediate use
  • check-iconCustomize templates to fit your organization's unique metrics

Why ZenAdmin

An easier way to power your company growth

icon

Boost Productivity

Expand your operations into new countries with ease.

icon

Increase Efficiency

Significantly reduce the administrative load on your HR and legal departments.

icon

Improve Performance

Minimize the risk of non-compliance penalties with proactive legal checks and balances.

icon

Revenue Growth

Ensure consistent adherence to international labor laws.

Boost ProductivityIncrease EfficiencyImprove PerformanceRevenue Growth

Seamlessly integrate your favorite tools with ease

[object Object]-icon
[object Object]-icon
[object Object]-icon
[object Object]-icon
[object Object]-icon
[object Object]-icon
[object Object]-icon
[object Object]-icon
[object Object]-icon
[object Object]-icon
[object Object]-icon
[object Object]-icon
[object Object]-icon
[object Object]-icon
[object Object]-icon
[object Object]-icon
[object Object]-icon
[object Object]-icon
[object Object]-icon
[object Object]-icon
[object Object]-icon
[object Object]-icon
[object Object]-icon
[object Object]-icon
[object Object]-icon
[object Object]-icon
[object Object]-icon
[object Object]-icon
[object Object]-icon
[object Object]-icon
[object Object]-icon
[object Object]-icon
[object Object]-icon
[object Object]-icon
[object Object]-icon
[object Object]-icon
[object Object]-icon
[object Object]-icon
[object Object]-icon
[object Object]-icon
[object Object]-icon
[object Object]-icon
[object Object]-icon
[object Object]-icon
[object Object]-icon
[object Object]-icon
[object Object]-icon
[object Object]-icon
[object Object]-icon
[object Object]-icon
[object Object]-icon
[object Object]-icon
[object Object]-icon
[object Object]-icon
[object Object]-icon
[object Object]-icon
[object Object]-icon
[object Object]-icon
[object Object]-icon
[object Object]-icon
[object Object]-icon
[object Object]-icon
[object Object]-icon
[object Object]-icon
[object Object]-icon
[object Object]-icon
[object Object]-icon
[object Object]-icon
[object Object]-icon
[object Object]-icon
[object Object]-icon
[object Object]-icon
Explore Our Integrationsicon